Reduced demand is allowing housing supply to accumulate
Home buyer demand continues to decline across the Metro Vancouver* housing market.
The Real Estate Board of Greater Vancouver (REBGV) reports that residential property sales in the region totalled 2,833 in May 2018, a 35.1 per cent decrease from the 4,364 sales recorded in May 2017, and a 9.8 per cent increase compared to April 2018 when 2,579 homes sold.
Last month’s sales were 19.3 per cent below the 10-year May sales average.
“With fewer homes selling today compared to recent years, the number of homes available for sale is rising,” Phil Moore, REBGV president said. “The selection of homes for sale in Metro Vancouver has risen to the highest levels we’ve seen in the last two years, yet supply is still below our long-term historical averages.”
There were 6,375 detached, attached and apartment properties newly listed for sale on the Multiple Listing Service® (MLS®) in Metro Vancouver in May 2018. This represents a 5.5 per cent increase compared to the 6,044 homes listed in May 2017 and a 9.5 per cent increase compared to April 2018 when 5,820 homes were listed.
The total number of properties currently listed for sale on the MLS® system in Metro Vancouver is 11,292, a 38.2 per cent increase compared to May 2017 (8,168) and a 15 per cent increase compared to April 2018 (9,822).
The total number of listings available today is 17.2 per cent below the 10-year May average.
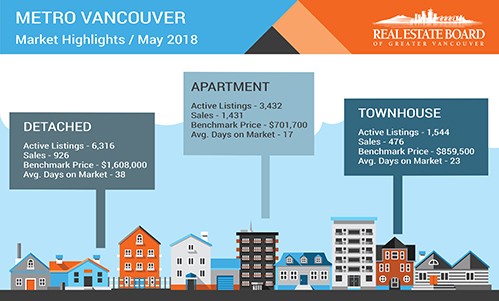
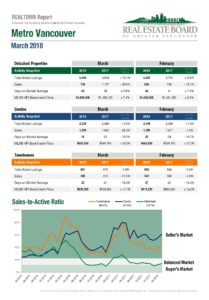
For all property types, the sales-to-active listings ratio for May 2018 is 25.1 per cent. By property type, the ratio is 14.7 per cent for detached homes, 30.8 per cent for townhomes, and 41.7 per cent for condominiums.
Generally, analysts say that downward pressure on home prices occurs when the ratio dips below the 12 per cent mark for a sustained period, while home prices often experience upward pressure when it surpasses 20 per cent over several months.
“For home sellers to be successful in today’s market, it’s important to price your property competitively given the shifting dynamics we’re experiencing,” Moore said. “It’s also important to work with your local Realtor to better understand these changing conditions.”
The MLS® Home Price Index composite benchmark price for all residential properties in Metro Vancouver is currently $1,094,000. This is an 11.5 per cent increase over May 2017 and a 0.2 per cent increase compared to April 2018.
Sales of detached properties in May 2018 reached 926, a 40.2 per cent decrease from the 1,548 detached sales recorded in May 2017. The benchmark price for detached properties is $1,608,000. This is a 2.4 per cent increase from May 2017 and a 0.1 per cent increase compared to April 2018.
Sales of apartment properties reached 1,431 in May 2018, a 29.3 per cent decrease from the 2,025 sales in May 2017. The benchmark price of an apartment property is $701,700. This is a 20.2 per cent increase from May 2017 and a 0.1 per cent increase compared to April 2018.
Attached property sales in May 2018 totalled 476, a 39.8 per cent decrease from the 791 sales in May 2017. The benchmark price of an attached unit is $859,500. This represents a 16 per cent increase from May 2017 and a 0.6 per cent increase compared to April 2018.
*Editor’s Note
Areas covered by the Real Estate Board of Greater Vancouver include: Whistler, Sunshine Coast, Squamish, West Vancouver, North Vancouver, Vancouver, Burnaby, New Westminster, Richmond, Port Moody, Port Coquitlam, Coquitlam, Pitt Meadows, Maple Ridge, and South Delta.
The real estate industry is a key economic driver in British Columbia. In 2017, 35,993 homes changed ownership in the Board’s area, generating $2.4 billion in economic spin-off activity and an estimated 17,600 jobs. The total dollar value of residential sales transacted through the MLS® system in Greater Vancouver totalled $37 billion in 2017.
Contact
Craig Munn
Manager, Communication
Real Estate Board of Greater Vancouver
604.730.3146
cmunn@rebgv.org
http://www.rebgv.ca/content/dam/REBGV/Documents/Statistics/Residential/Media%20Stats%20Package/2018/2018-05-May-Stats-Package
http://members.rebgv.org/realtorlink/rebgv/statscentrereports/Metro-Vancouver.pdf